Skip to content
fosk
Simulated waterfall. The strongest signal spells a name.

Things I build after hours.

I'm Sandro Cavalieri Foschini, fosk online. By day I work in networking and cybersecurity. This is where I keep what I make out of curiosity, or to solve a problem of my own.

The formal version of me is at sandro.cavalierifoschini.it.

On the bench

gputaskman GUI

Windows, Linux, macOS · v0.3.0 · in development

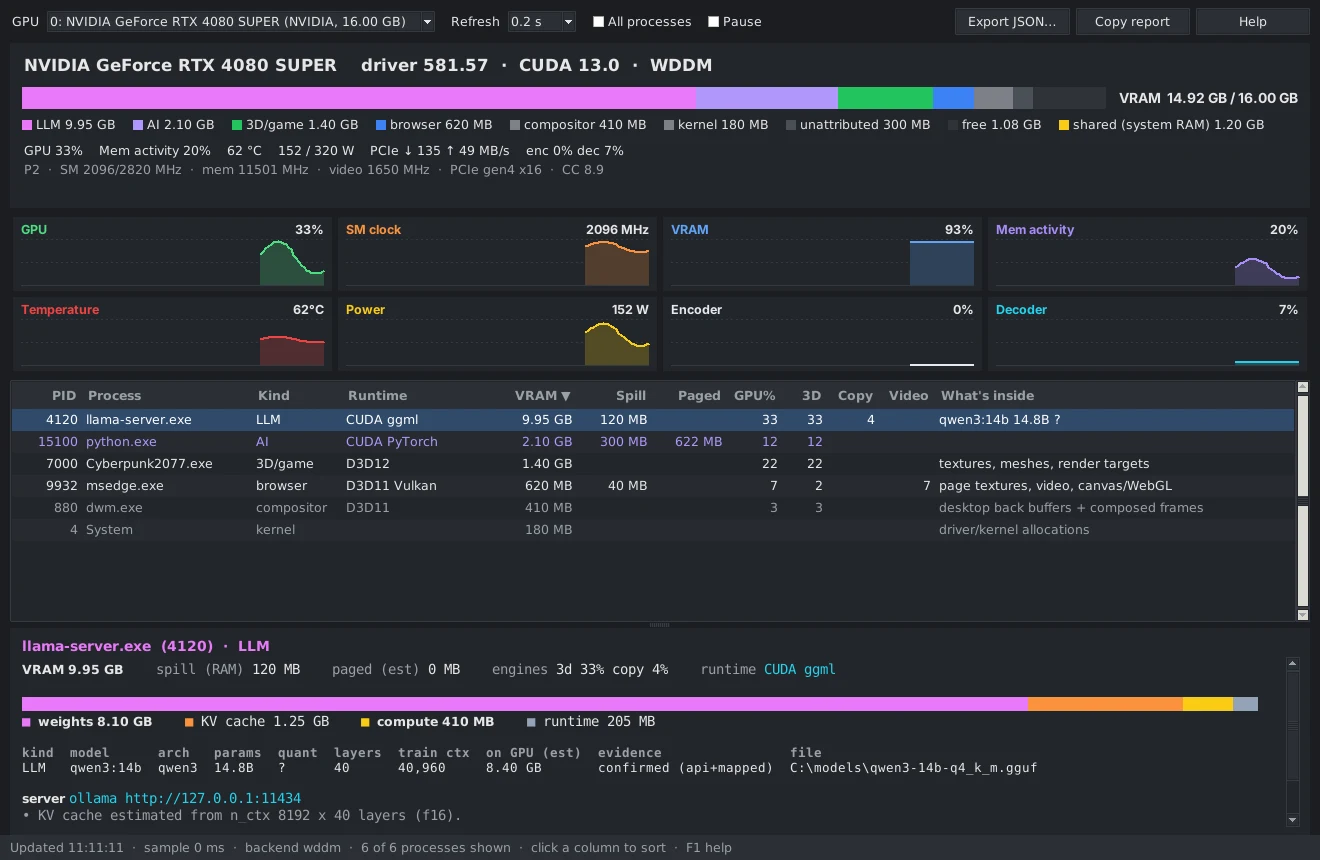
A graphical GPU monitor built on a fork of gputaskman. It shows what's using the graphics card, and why.

VRAM is broken down in real time across LLMs, AI processes, games and browsers, next to utilization, temperature, power and clocks. For local models it goes deeper: weights, KV cache, parameters and the loaded file.
Source on GitHub

gputaskman GUI: VRAM bar split by category, GPU, temperature and power charts, process list and details of an LLM

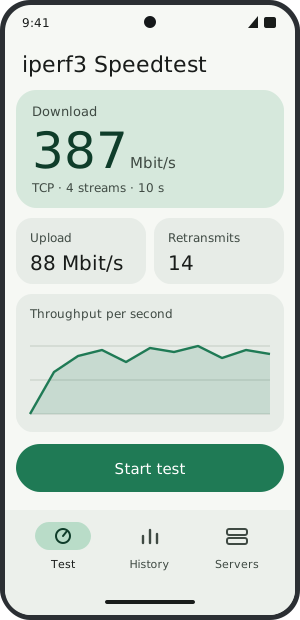
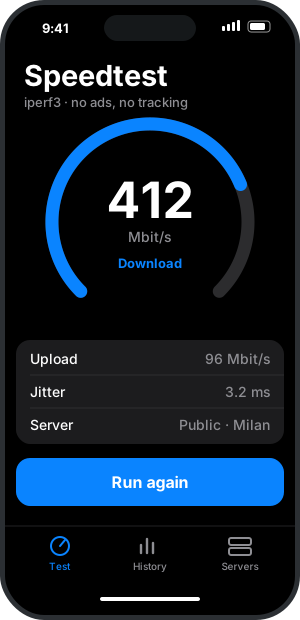
iperf3 speed test

Android, iOS · in design

An app for measuring real bandwidth against public iperf3 servers, with no ads and no tracking. It doesn't exist yet: these are concept mockups.

iOS concept mockup: download speed on a circular gauge, upload, jitter and server Android concept mockup: download speed, upload, retransmits and a per-second throughput chart

Does the link close?

A sum I've done hundreds of times, in pocket form. Follow the signal from the transmitter to the receiver: it has to arrive above the sensitivity line, with some margin to spare.

Frequency

GHz

sensitivity
Path loss
Received
Margin
Fresnel radius

Free-space estimate, with the Fresnel radius at mid-path. A real design adds rain, oxygen absorption at 60 GHz, obstructions, cables and power limits.

What I'm poking at

Elsewhere